Crash Course of Texture

Content:
Texture and Anisotropy of Crystalline Materials
A crystal is characterized by the periodic arrangement of its elements (atoms, ions)
in space.
This always generates a dependence of the crystal properties on the chosen direction,
which is called anisotropy.
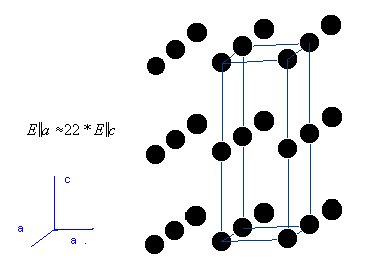
Thus, the modulus of elasticity can vary by the factor 22 in a graphite crystal
depending on the direction.
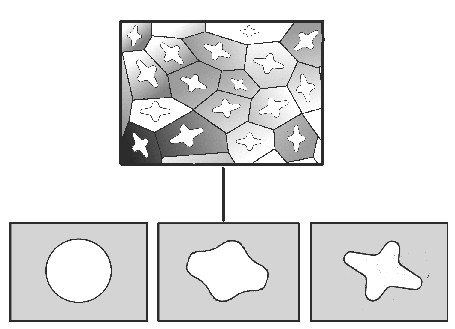
Most natural or artificial solids (rocks, ceramics, metal alloys or polymers)
contain of many crystallites of different size, shape and different orientations.
They are usually multi-phase substances, i.e. they contain several
crystalline phases of different structure.
The most important parameter describing the anisotropy of polycrystalline materials
is their texture.
Via the anisotropy of physical properties due to the lattice structure, a regular
texture in which the crystallites of one phase have only a few preferred
orientations produces anisotropy of the polycrystalline material as well.
- polycrystalline materials: metals, alloys, intermetallic compounds,
ceramic materials, compound materials, polymers, semiconductors, nanocrystals,
supraconductors, rocks;
-
-
-
- texture-modifying processes: deformation, recrystallization,
phase transformation, synthesis of layers by plasma or laser and ion beams,
crystallization at interfaces, rigid particle rotation;
-
-
-
- anisotropic properties: plasticity, elasticity, hardness,
strength, cleavability, thermal expansion and conductivity,
electric conductivity, magnetization, corrosion resistance, optical properties.
-
-
-
-
-
The great variety of texture-modifying processes described here generates an even
greater number of material-specific textures, since the different phases present
in a material react differently due to their structure and properties;
this is also documented by different textures.
Therefore, the knowledge of the initial and final textures of a sample is the
most important precondition for the investigation and description of
texture-modifying processes and their conditions.
Only this knowledge
allows the systematic manipulation of anisotropic properties in polycrystalline
materials (manufacture of design materials).
Content
Coordinate Systems
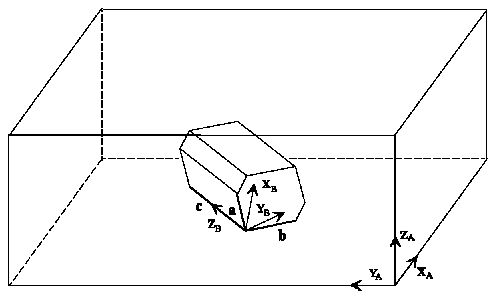
To describe the orientations of a crystallite, Cartesian right-hand coordinate
systems must be fixed for both the sample and the crystallite.
Uniform conventions must be agreed for the application of the coordinate systems
to allow the comparability of various textures.
The sample coordinate system KA is usually adapted to the process geometry if it is known. Thus,
the rolling direction R is selected parallel to XA
and the normal direction N is selected parallel to ZA for a rolled sample.
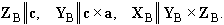
The crystal coordinate system KB should be fixed to the basis vectors
a, b and c of the Bravais lattice as follows:
Content
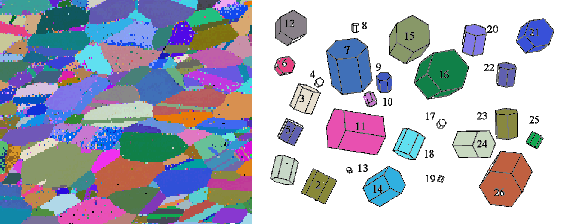
Crystal and Sample Symmetry
Crystal and sample symmetry are the reason that there are several equivalent possibilities
for fixing the crystal and sample coordinate system:
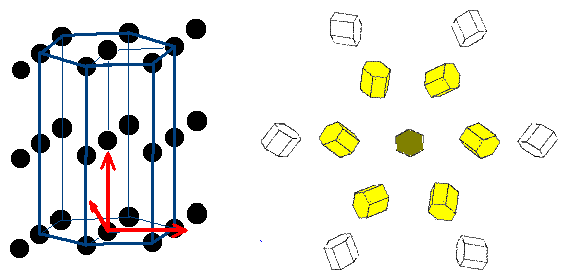
Evidently the crystal symmetry does not lead to a multiplication of the crystallite orientation
since the crystal lattice is projected on itself by the symmetry operations (left figure).
In contrast, the sample symmetry produces the existence of several crystallites
with evidently different orientations which are, however, equivalent in terms of the
sample symmetry.
In the right-hand figure, these are each represented in the same
color for three different orientations.
The sample symmetry is given by the point group C6 here.
Imagine a pyramid-shaped sample with a hexagon as basis that lies parallel to
the drawing plane.
A sample symmetry is caused by the texture-modifying process or the environment
of the crystalline phase.
The example shows 13 preferred orientations of a thin film (crystal symmetry D6h)
that was produced on an also hexagonal monocrystalline substrate.
Since the c-axis of the substrate crystal is parallel to the sample normal,
there are five more equivalent preferred orientations for each preferred orientation.
In special cases (i.e. for special orientations) the equivalent orientations
can coincide (olive-green crystallite).
Content
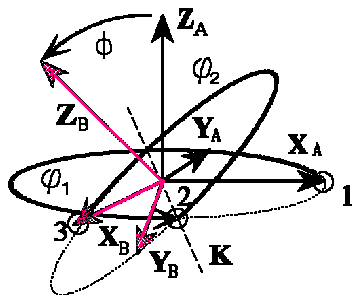
Representation of Orientations by Euler Angle - G-Space
An orientation g is described by that rotation that transforms the sample-fixed coordinate system
KA into the crystal-fixed system KB of the crystallite in question.
If the rotation is subdivided into three partial rotations to be performed successively (K knot line):
- transforms XA Þ K, rotation axis : Z (ZA),
rotation angle:j1,
- transforms ZA Þ ZB, rotation axis : K,
rotation angle: F,
- transforms K Þ XB, rotation axis : Z (ZB),
rotation angle:j2,
the Euler angles (j1,F,j2)=g
are obtained as orientation parameters.
Each rotation by the rotation angle 2p+a
around any rotation axis is identical to a rotation with a.
Thus the space of all orientations (shortly G-space) is cyclic, self-contained and completely
described by

.
Content
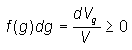
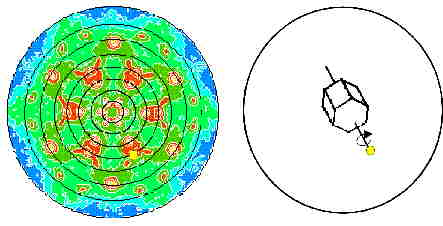
The Orientation Density Function (ODF)
The ODF f(g) allows to quantitatively describe the texture of a crystalline phase.
In a thought experiment, let all crystallites of a sample be sorted into
a lettercase according to their orientation:
The frequency (the volume fraction) of all crystallites with the orientation g in dg
(dg characterizes the size of a box) is here represented by the unit cell of the
crystal lattice (in this case a hexagonal one).
When the limits dgÞ0 are exceeded, the frequency is
transformed into the functional value f(g) so that the ODF f(g) is defined by the
relationship
where V is the sample volume and dVg the volume of all crystallites with the
orientation g in the angular element dg.
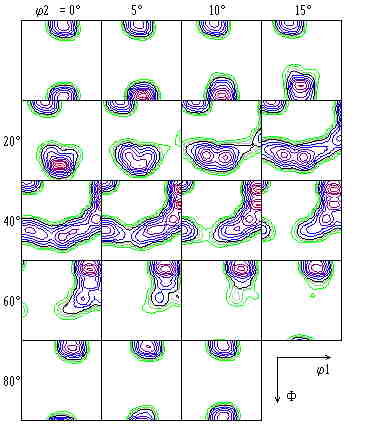
The usual graphical representation of the ODF is by Euler sections.
The Euler angles j1,F,j2
projected to right-angle coordinate axes, which considerably distorts the spherical G-space.
In view of the crystal and sample symmetry in the current example (cubic/tetragonal and orthorhombic),
the representation is possible in a reduced basic range
0£j1,F,j2£p/2.
Boundaries of the basic range of ODF representation in the Euler space:
Boundaries for j2 and
F with respect to all possible crystal symmetries (the cases marked * produce
triple ranges):
| GB | C1 | C2 |
D2 | C3 | D3 |
C4 | D4 | C6 |
D6 | T* | O* |
| F£ |
180° | 180° | 90° | 180° | 90° |
180° | 90° | 180° | 90° | 90° | 90° |
| j2£ |
360° | 180° | 180° | 120° | 120° |
90° | 90° | 60° | 60° | 180° |
90° |
Boundaries for j1 for triclinal, monoclinal and
orthorhombic sample symmetry:
| GB | C1 | C2 | D2 |
| j1£ |
360° | 180° | 90° |
Content
Up to the nineteen-sixties, statements on textures were made practically exclusively
on the basis of pole figures and estimated preferred orientations (ideal positions).
Nowadays their importance is due to the fact that they are easily available by experiments.
An important task of texture analysis and the MulTex program is therefore to
calculate the ODF of each phase in a sample from the measured pole figures.
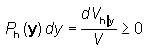
A pole figure is defined by the relationship
i.e. it is proportional to the volume fraction of all crystallites whose crystal direction
h is parallel to the sample vector y .
In the measurement, y describes the direction of the scattering vector of the
diffractometer relative to the sample coordinate system.
By suitable sample rotation y can comprise the entire angle range (pole sphere).
Due to Friedel's law according to which the intensity of the diffracted beam is equal
for +y and -y, only 50 % of the angular space must be scanned.
Experimental limitations lead to smaller measurement ranges
in most practical cases; the results are called incomplete pole figures.
The left-hand figure shows the complete experimental (112) pole figure of a
hexagonal GaN layer. Small PF values are colored blue and high ones are colored red.
In the pole figure, a relative maximum with the sample direction yp
is visible which is marked by a yellow point.
The right-hand figure shows a crystallite whose crystal direction
hp=(112)is parallel to p. It makes a contribution to the corresponding
pole figure value.
The two vectors are coupled with each other by by hp=gyp
(or hp||yp) via the crystal orientation g (rotation transforming
KA to KB), with other words, the orientation g projects yp
onto hp.
In addition to the crystallite with the represented orientation,
all crystallites make a contribution to the "yellow" pole figure value
if their orientation can be obtained from the indicated orientation by any
rotation around the indicated axis.
The totality of these orientations gp(j)
is called projection path since all these orientations project the sample direction
yp on the crystal direction hp
via hp=gp(j)yp .
This is the basis for the following important statement:
Pole figures are two-dimensional projections
of the three-dimensional ODF(texture) !!
Texture calculation from pole figures, which is the aim of the MulTex program,
is a tomographic problem
(in the orientation space) whose solution is based on the knowledge of the projection path.
Zum Inhalt
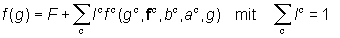
Texture Approximation by Model Components
Due to the considerable size of the orientation space,
a complete texture description usually requires very large amounts of data.
For a given orientation distance (resolution) of approx. 5° and triclinal
crystal symmetry, ODF values for about 120 000 knots have to be indicated.
On the basis of the orientation distance, however, so-called texture components,
i.e. "mollified" individual orientations, can be defined that allow the texture
to be described with considerably less parameters (data compression).
If these components are suitably chosen, the textures of large sample series can
be exactly compared, and texture changes and the processes causing them
can be quantitatively described.
Based on the assumption that each real texture can be described, in good approximation,
as a superposition of a finite number of texture components of different shape and
scattering width (c-component index):
a geometric approximation method for the texture calculation from
diffraction pole figures was developed,
which can also be used for multi-phase samples.
The component parameters
- volume fraction Ic
- preferred orientation gc
- fiber axis fc
- scattering widths ac, bc
are interactively and successively estimated on the PC screen and
subsequently improved by nonlinear optimization (see Example).
The reduction of the texture data to a few components allows pole-figure-based
texture estimations that are highly limited both qualitatively (measuring error)
and quantitatively
Content